Exploring the Portfolio Workbench
September 26, 2014
We did four special studies this week with the Portfolio Workbench that we thought that you might find interesting.
S&P 1500 Portfolio
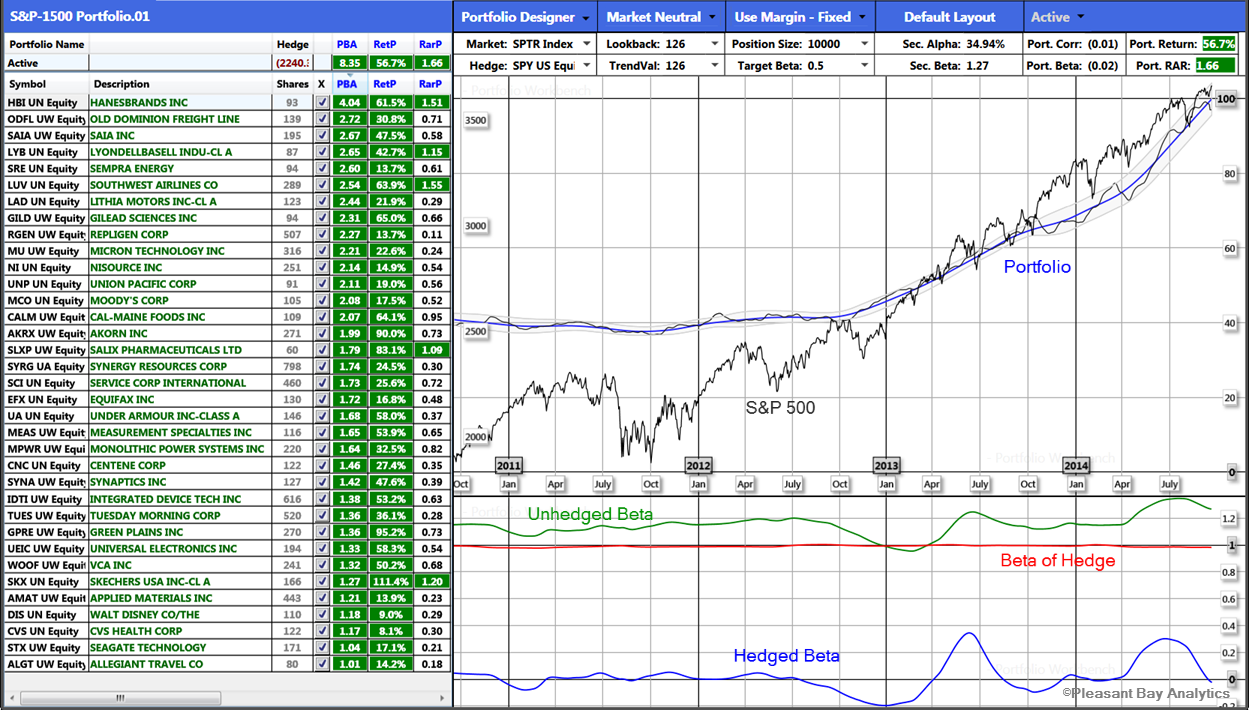
This study is a new market neutral (Beta = 0) portfolio from the combined S&P 400, S&P 500, & S&P 600, (the S&P 1500) universe of stocks. We selected those with green PBA and RetP columns that have at least three years of data with consistent out-performance (positive Alpha) over those three years.
This portfolio is currently making about 1% per week with a Sharpe Ratio of 1.6 and should not be affected very significantly by a market correction.
Alpha of the S&P 1500 Stocks
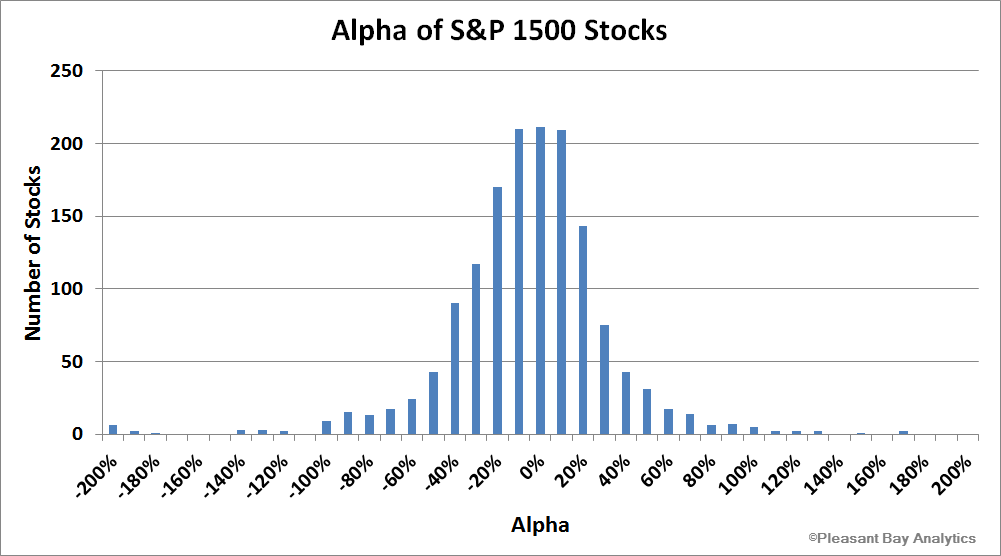
The economics text books tell us that the Alpha of all stocks should be zero – that investors would buy up all the stocks with positive alpha, raising their prices until there was no out-performance potential left. That is clearly not the case if you measure Alpha correctly. This chart shows the distribution of Alpha of the S&P 1500 stocks using a six-month look-back window.
It looks a lot like the familiar “bell-shaped curve” (“Normal” distribution) to us! For many of these the out-performance has lasted for years.
This was plotted by using the “Export Matrix Data to CSV File” command and then using Excel to plot the graph using the Excel “FREQUENCY” function.
Common World Equity Index Rainbow Chart
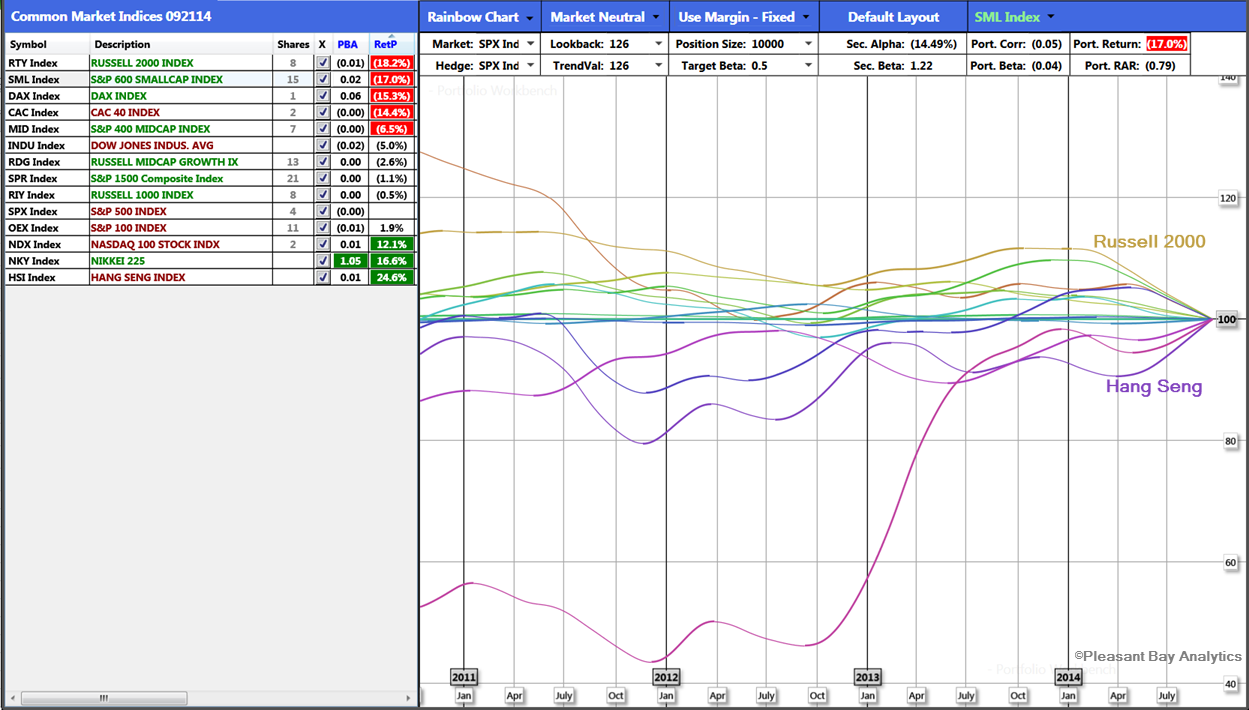
A Rainbow Chart of the common world equity indices shows the Russell 2000 as the weakest with an Alpha of -18% vs. the S&P 500.
All other U.S. indices except the Nasdaq 100 are also under-performing the S&P 500. The Nasdaq 100 has an Alpha of +16% vs. the S&P 500.
The best-performing is the Hang Seng with an Alpha of 24% vs. the S&P 500. The list is sorted by recent performance with the order matching the current slopes on the chart (Alpha) with the best performing at the bottom of the list.
The QLD / TWM Spread
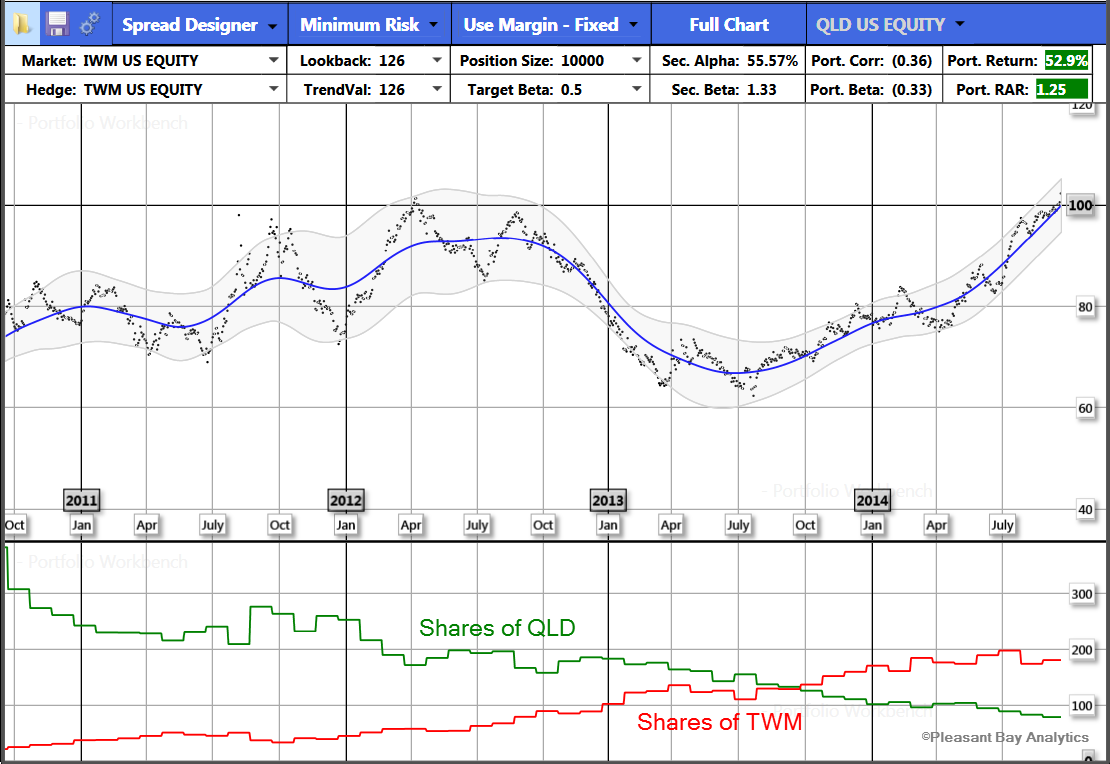
Since the Nasdaq 100 is the strongest index and the Russell 2000 the weakest, using a spread of the leveraged ETFs should be making money. This study shows the spread:
- Long $10,000 of the +2x leveraged Nasdaq 100 (QLD)
- Long the amount the -2x leveraged inverse Russell 2000 ETF (TWM) that minimizes the volatility of the spread using margin in a $10,000 margin account.
This spread is currently making about 1% per week with a Sharpe Ratio of 1.2 and should not be affected significantly by a market correction. It has been profitable for about 15 months with no sign of slowing down.
This study assumed rebalancing the spread monthly. The number of shares required on each side each week is shown in the lower graph of the chart.
Bob Fulks